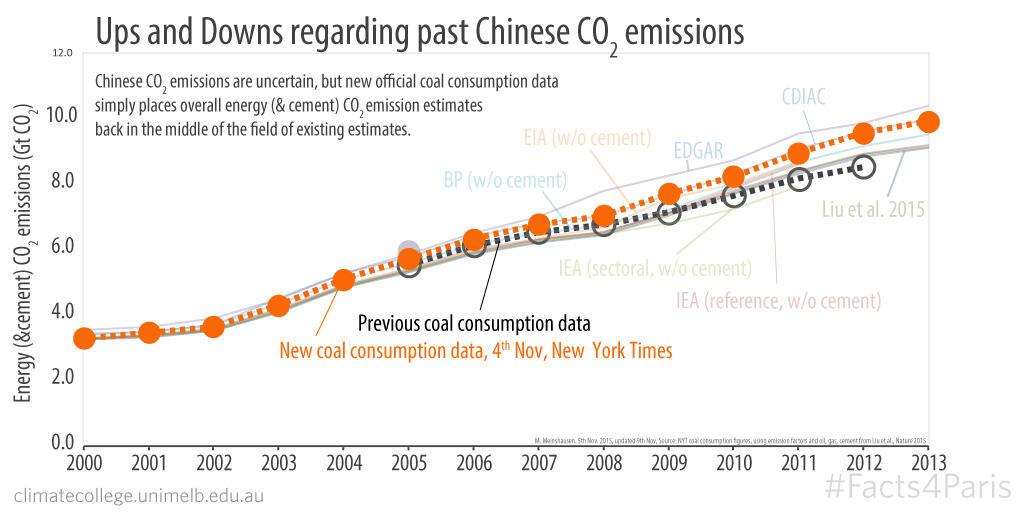
Facts4Paris: Chinese CO2 emissions may be uncertain but existing estimates are still valid.

Yesterday the New York Times reported that Chinese coal consumption may be 17% higher than was previously thought. The article was picked up by other media outlets such as The Guardian and TIME. Obviously, this is not great news. But it's also not as bad, or as revelatory, as is being suggested.
Using the revised coal consumption figures to calculate Chinese CO2 emissions simply puts official estimates back into the middle of the range of what many other studies have previously calculated.
To illustrate, the above graph shows estimates of total Chinese CO2 emissions by:
- The CDIAC, which is the Carbon Dioxide Information Analysis Center run by the US government (data includes energy and cement emissions).
- The EDGAR, which is the Emissions Database for Global Atmospheric Research run by the European Commission JRC Joint Research Centre and the Netherlands Environmental Assessment Agency (data likely overestimates some emissions factors).
- The IEA, which is the International Energy Agency (data excludes cement emissions).
- The EIA, which is the US Energy Information Administration.
The graph shows that whether you choose the old coal consumption data (black dashed line) or the new coal consumption data (orange dashed line), the emissions estimates are still within the range of existing studies.
In fact, the announced revision of Chinese energy statistics is not really new (see e.g. here or here), nor does it undermine the Chinese peaking or intensity targets for Paris. On the same day that the Chinese INDC was announced in July 2015, a national expert study was published using the 2014 revised figures (see Figure 4 of Fu Sha et al). One month later, in August, a prominent study by Liu et al. revisited all the emission factors revalidating those that have been in use in China (and also suggesting that some other emission factors have been too high).
In short, there is and always has been uncertainty regarding Chinese CO2 emissions. However, the revelation by the New York Times is neither new, nor does it put the Chinese INDC into question.
Note: To calculate the black and orange dashed lines we used an emission factor of 0.5 tonnes of carbon per tonne of coal based on the findings by Liu et al. and we adopted their best-estimates for gas, oil and cement emissions. For the coal consumption data we used the figure plotted in the New York Times article. We note that at this stage the Chinese Statistical Yearbook 2014 does not feature the upward correction that the New York Times has reported. Supplementary data made available by Liu et al. is greatfully acknowledged. PS: The figure was updated on 9th Nov. We corrected the lower 'previous coal use' emission trajectory (black circles and black dashed line), as previously we erroneously adopted the Liu et al. implicit coal use data, rather than the one shown in NYT. The emission trajectory based on the new coal use data (orange line) is unchanged.
